NetScan in brief
- Real-time, continuous mobile network monitoring, processing and data analysis.
- Covers 2G RAN (A, Abis, Gb) and selected 3G RAN (Iub, Iur IuCS, IuPS) and LTE (S1) interfaces. In addition, process data from traceports of key vendors (LTE RAN monitoring).
- Shared-RAN (MOCN & MORAN) support including secure separation of data between MNO’s involved.
- Reach set of pre-defined KPI’s (CSSR, CSTR, etc.) aggregated per cell, project, region and BSC/RNC, and cluster of cells.
- Real-time KPI monitoring and alarming per cell and BSC/RNC.
- Real-time monitoring of QoE and alarming per VIP subscriber (High Value Account).
- Network-wide session analysis (e.g. calltracing) with message correlation.
- Message decoding down to bit level.
- Open architecture ready to deploy new features (integration with external systems like data warehouse, CEM, etc.).
- Support for Gn interface (User and Control Plane monitoring with Deep Packet Inspection and Classification).
- Voice Quality Scoring — voice waveform processing (VoQA):
- Impairment detection based directly on decoded voice analysis.
- Clipping, dead-air, echo detection.
- Estimates true quality of voice communication.
- All major voice codecs are supported.
- In the road map:
- Advanced Geo-location.
- Advanced algorithms to support radio-planning (HO relations optimisation, coverage analysis, geo-service analysis).
System Architecture
- Highly distributed, scalable system architecture to cope with high load.
- Network signalling monitored through a chain of smart TAP’s feeding local servers with pre-filtered data.
|
- Captured PDU’s are decoded and processed to calculate KPI’s and correlate on various Levels.
- Supports multi-interface correlation, including inter-BSC and inter-system handovers.
|

Two-step data processing

- Captured PDU’s are streamed transparently into a file to guarantee lossless data acquisition and buffer peaks of traffic.
- PDU’s from recorded streams are processed, correlated into transactions at various levels and indexed. Some low-level statistics are also calculated at this stage. Records and statistics are stored into a local DB while processed PDU’s are kept in indexed files.
Distributed information storage

- Captured data-streams are processed in real time on local servers.
- Captured PDU’s are correlated at various levels to form DCH transaction, RAN-Core association, NAS transaction, etc.
- Transaction records and statistics are stored in distributed database.
- Users access data in a system through central server and WEB-based application.
User-friendly Interface

- Users access system via easy-to-use, intuitive WEB application.
- No single component needs to be installed on the end-user computer. Just WEB browser.
- Secure access via ciphered connection and domain-based user login (SSO - Single Sign-On).
- User access-rights are controlled by system administrator and allows for geographical and MNO’s data isolation.
- All user activity is securely logged to prevent sensitive data leakage.
Network status indication

- Network-status screen visualises values of statistics with colours indicating violation of statistics' pre-defined thresholds.
- All elements on screen are active – with a single click one can see statistic details, detailed cell analysis or signalling transactions.
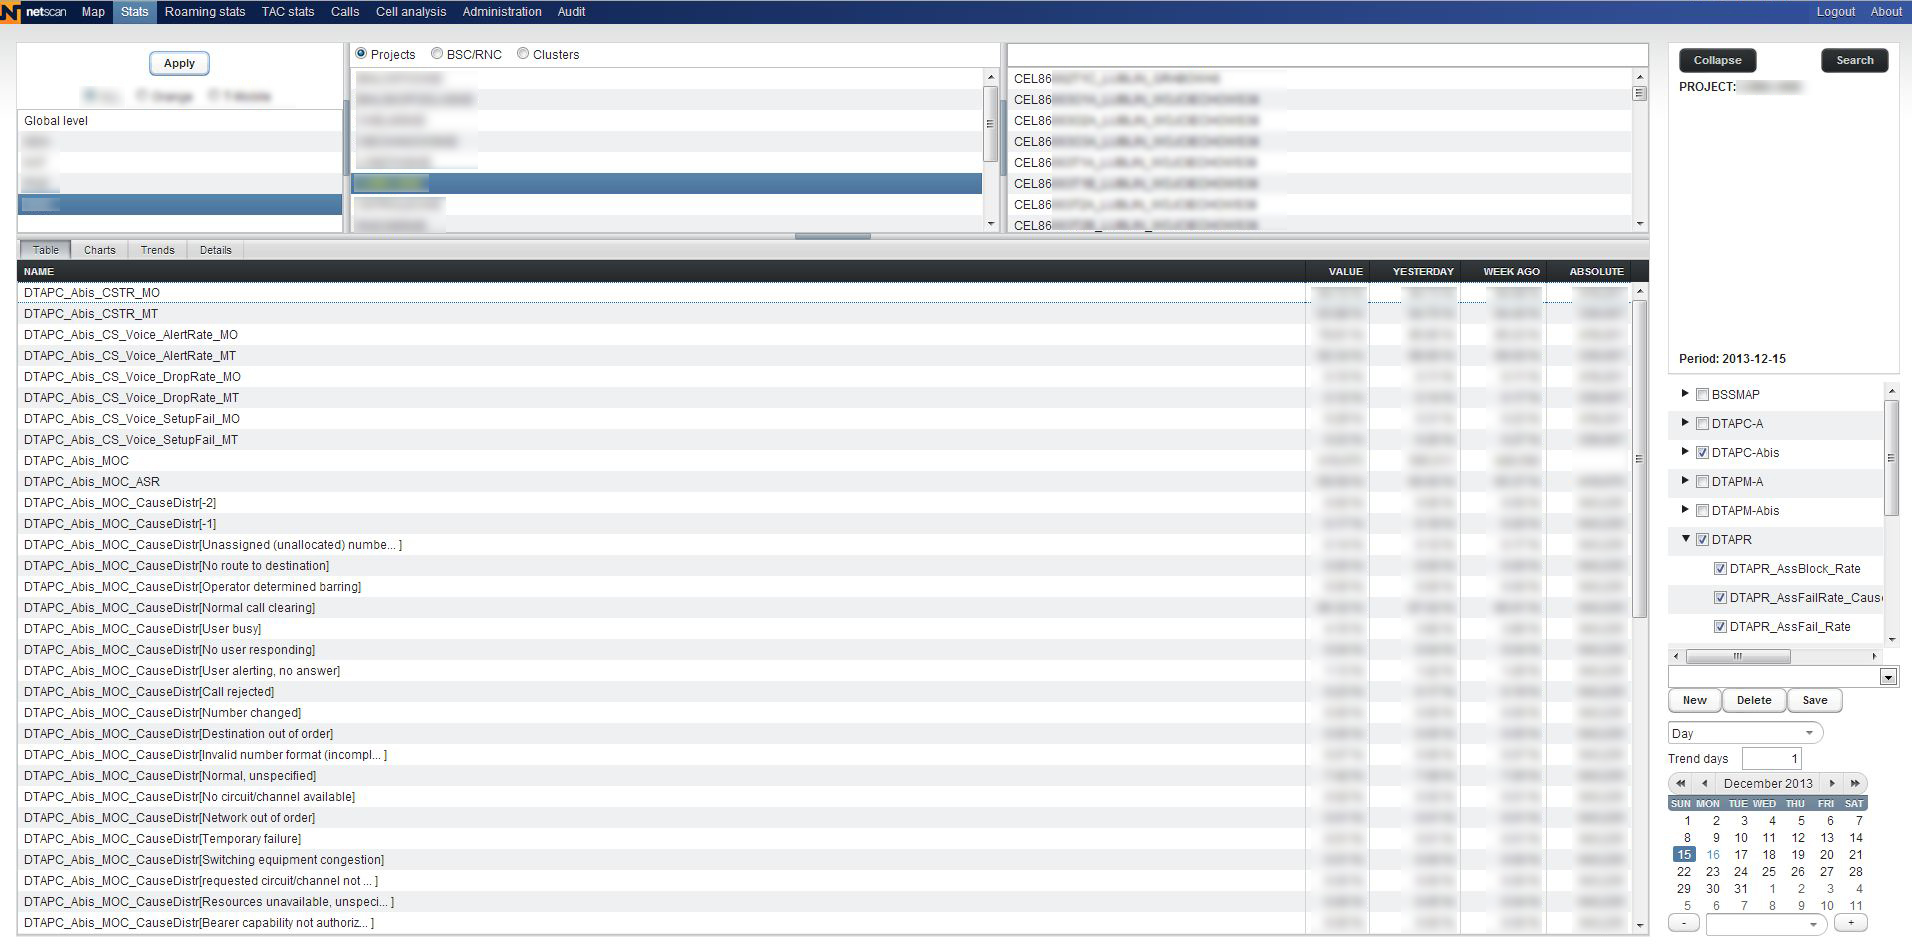
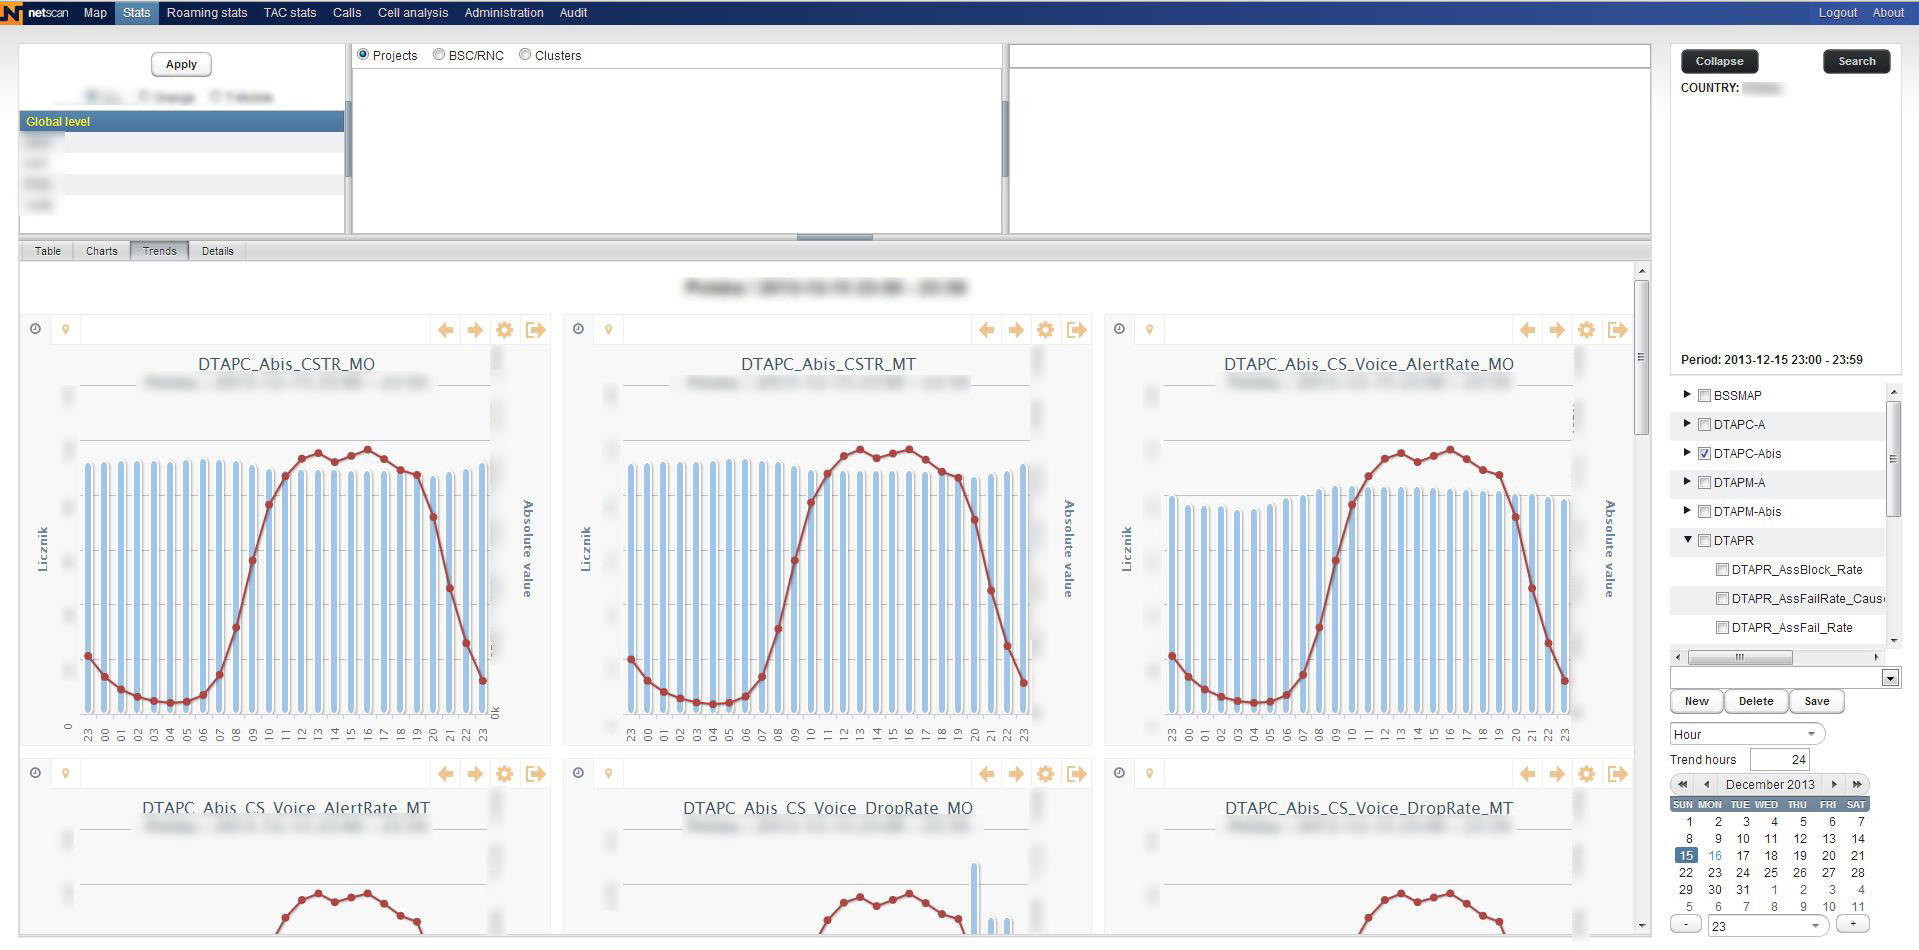
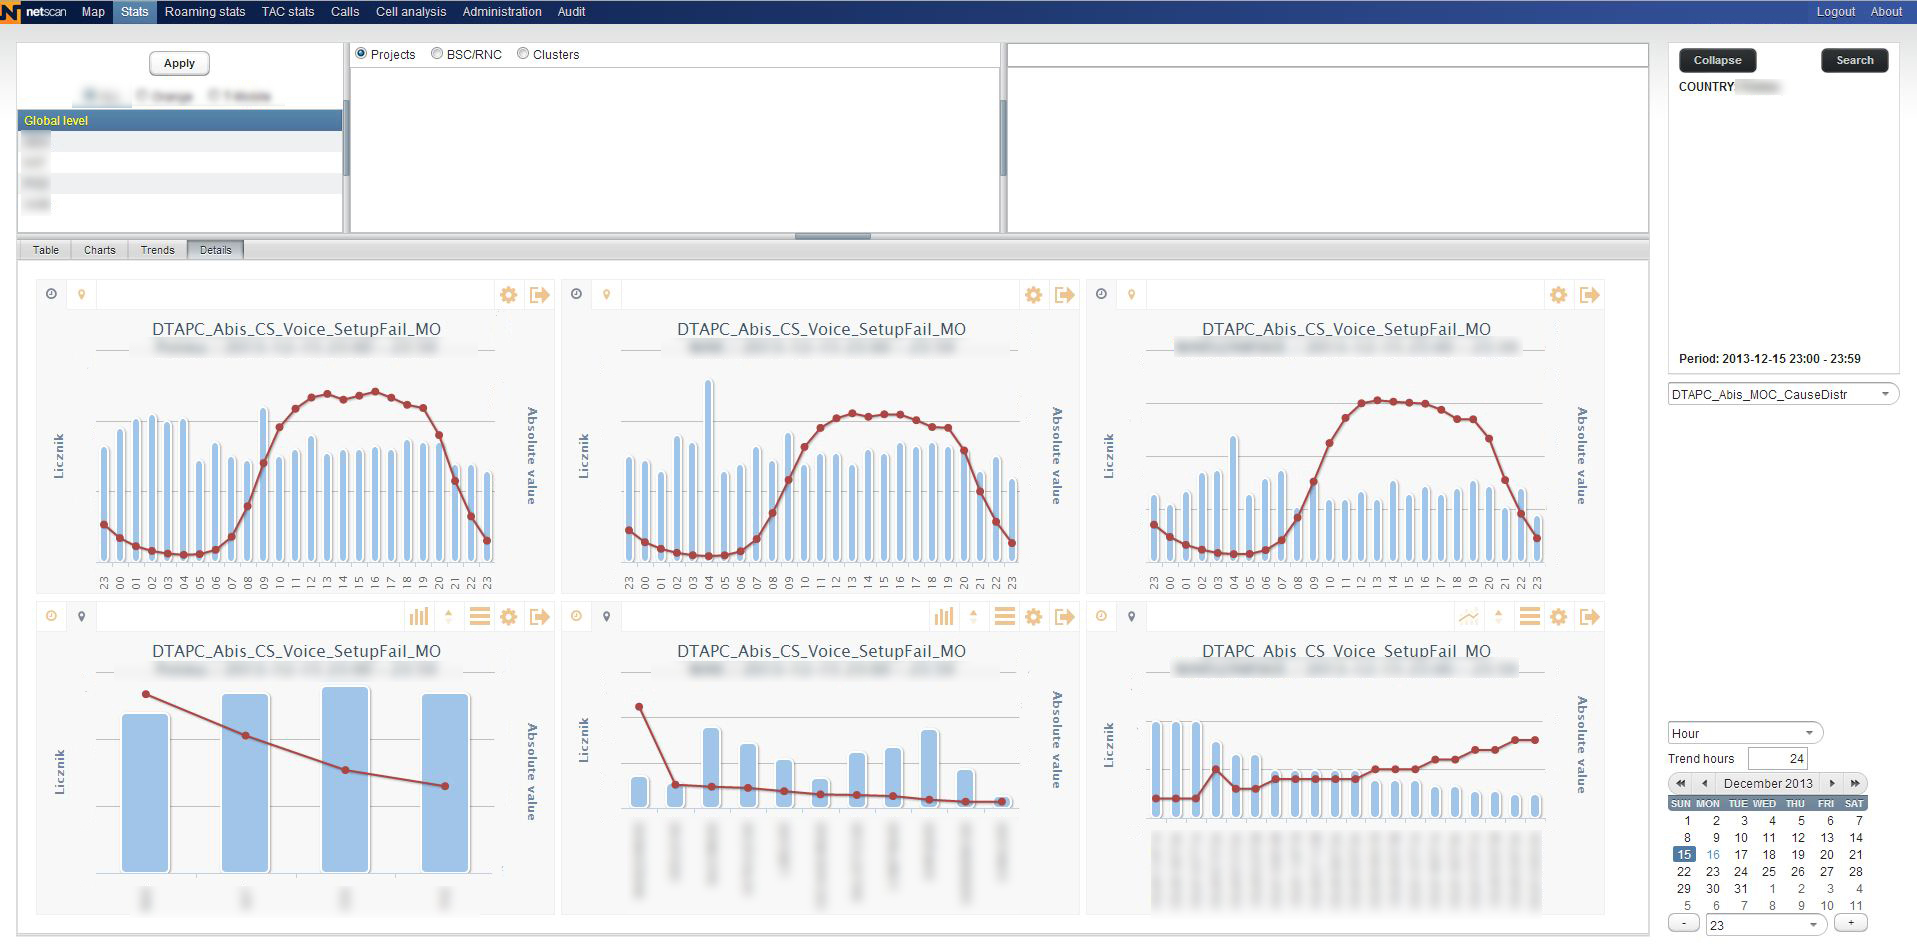
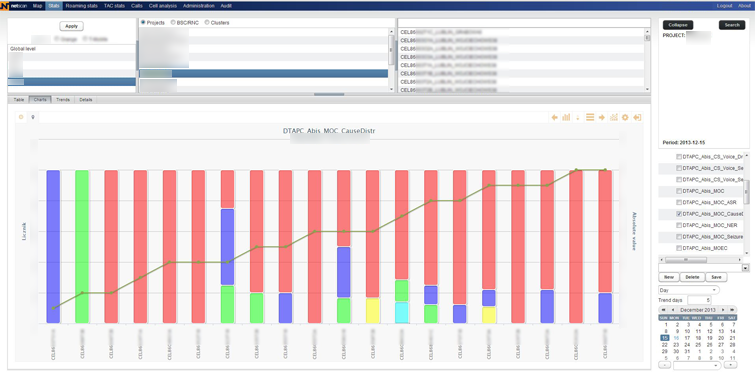
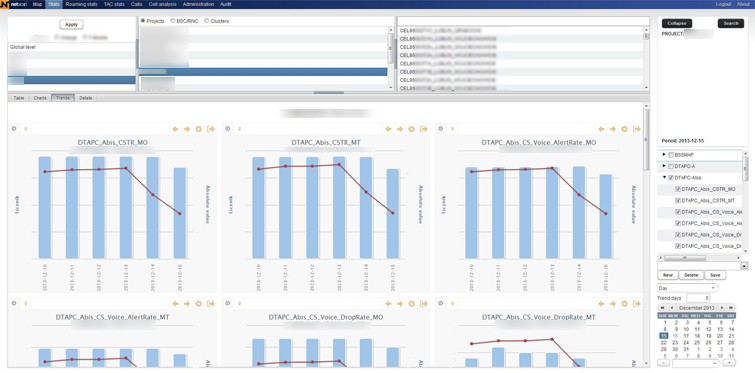
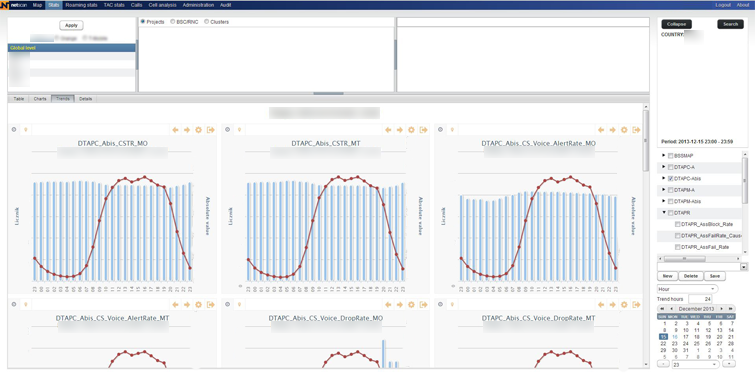
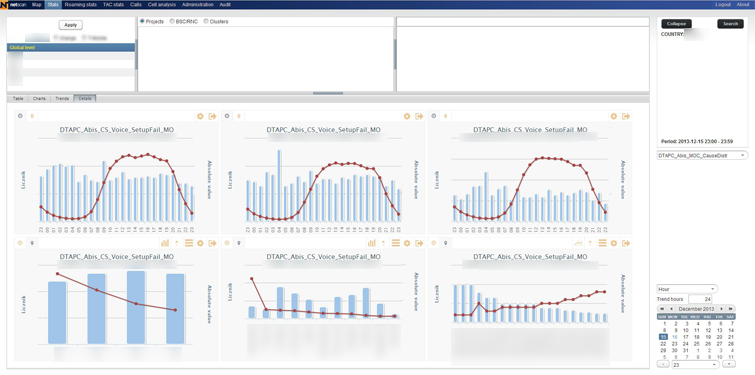
Statistics
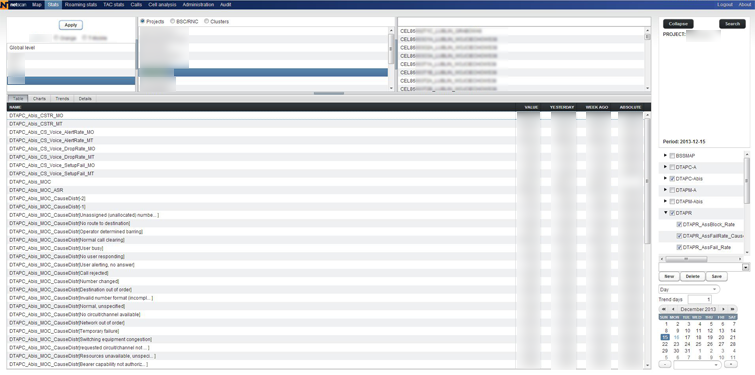
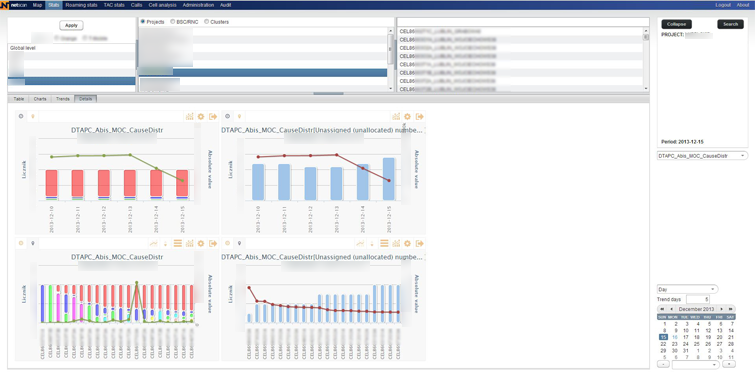
- Multiple statistics in one table.
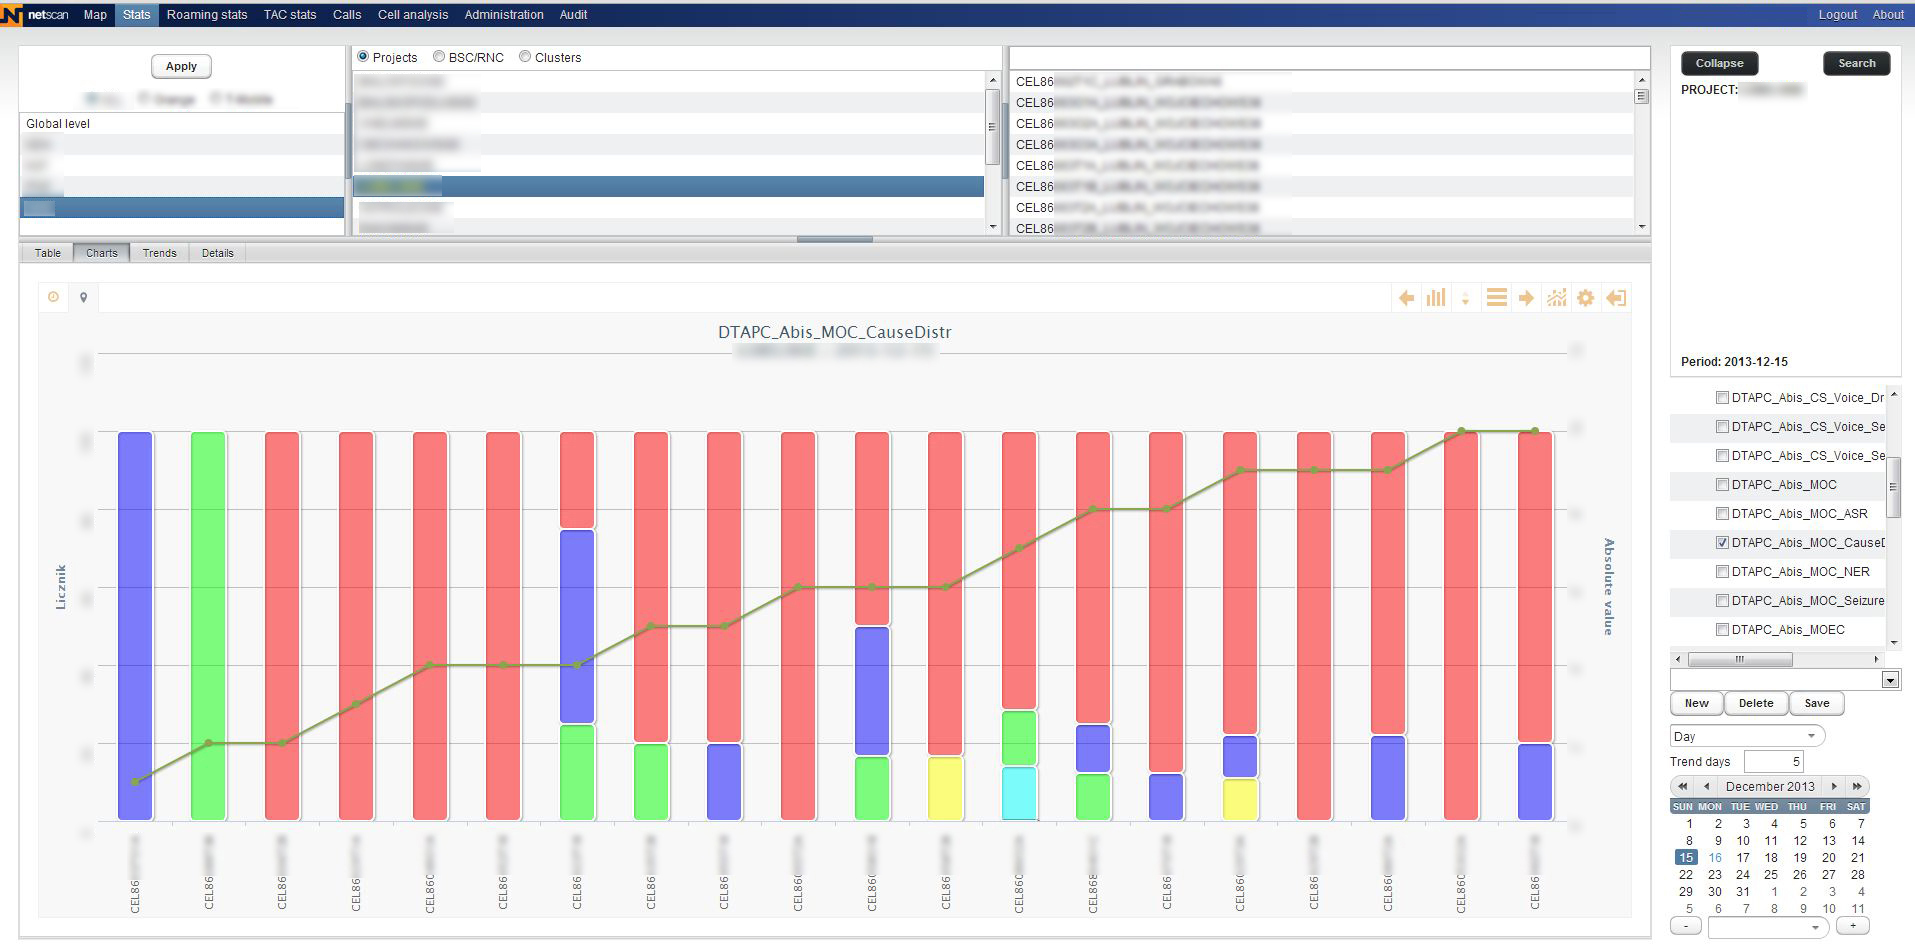
- Graphical visualisation of many statistics in common geo- and time contexts.
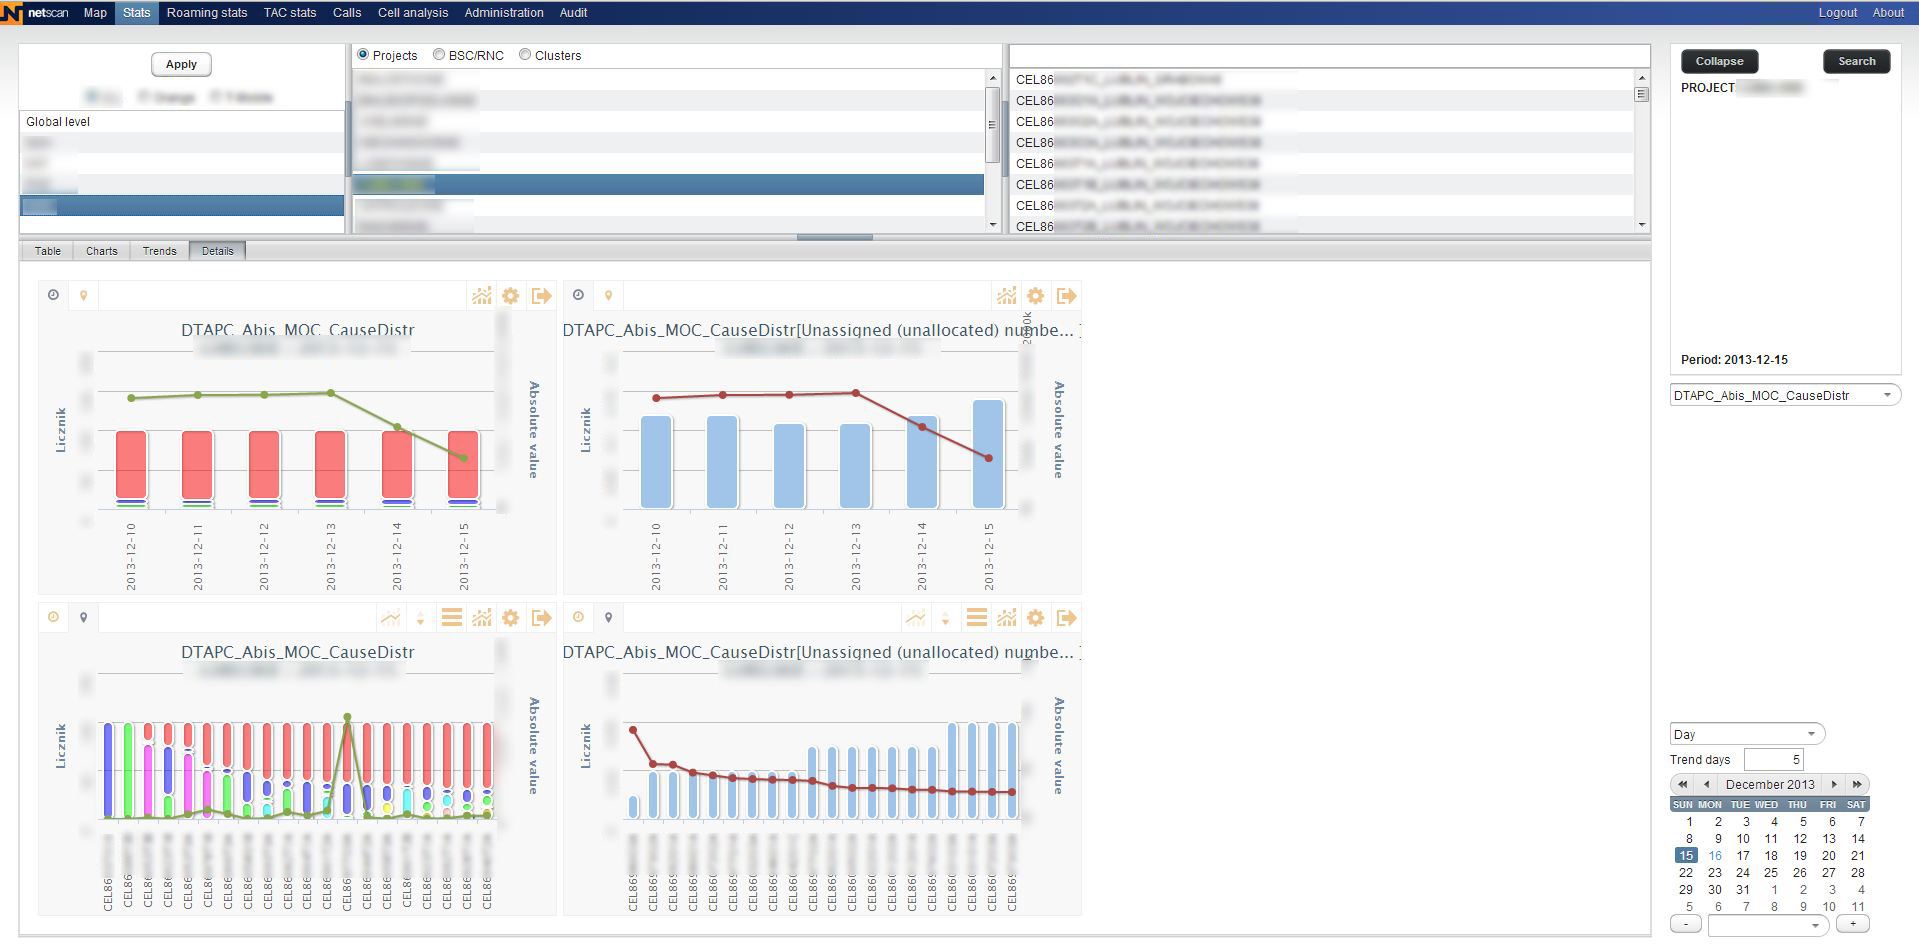
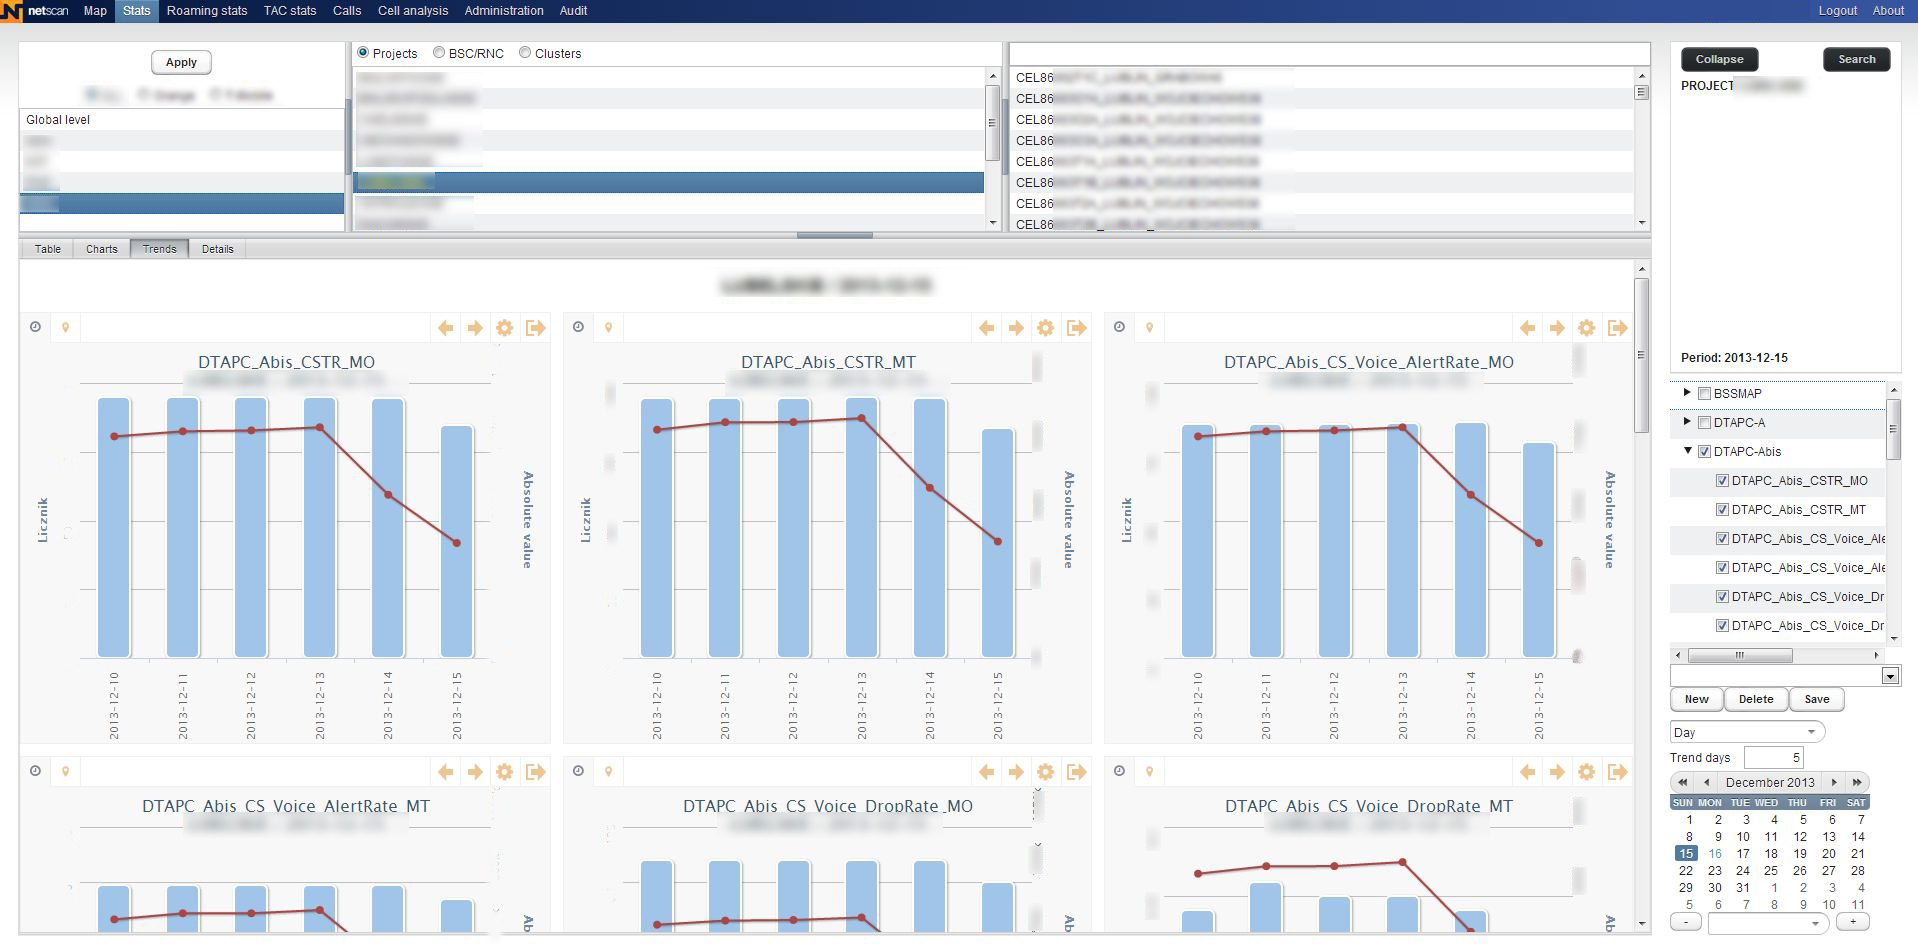
- Graphical visualisation of a single statistic in many geo- and time contexts.
Roaming statistics

- Inbound roamers statistics.
- Roaming statistics can be narrowed into region, project or particular BSC/RNC.
- Table can be sorted per each column.
User-terminal statistics

- Selected statistics are distributed per terminal model and terminal vendor (TAC distribution).
Call tracing


Calls can be traced based on:
- localisation (Region->Project-> BSC/RNC->cell),
- terminal or user identity (IMEI, IMSI, TMSI),
- selected transaction parameters (termination cause, type of transaction, etc.),
- specific events – like unsuccessful HO.
Transaction details

- Calls can be analysed in tabular and graphical formats.
- Another window conveniently illustrates handover flows.
- Last but not least, a window shows all parameters reported in MR messages and all important RAN events.
Measurements are correlated with particular cells.
Cell analysis

- 3-dimensional graphs illustrate correlation between specific measurements reported in MR messages for the selected cell and time.
- Graphs are available for: down-link Rx level vs quality, up-link Rx level vs quality, timing advance vs up-link quality, timing advance vs down-link quality.
Roadmap
- Advanced Geo-location.
- Advanced algorithms to support radio-planning (HO relations optimisation, coverage analysis, geo-service analysis).
- Radio-experience management.